Image Gallery

In vivo space-time images showing automated measurement of capillary blood velocity, along with snapshots of exemplary cartesian images showing a single moving blood cell

Blood flow in a single capillary path is imaged without contrast agents. Top A single blood cell travels through a capillary (dashed green trace). Movement of this cell over time is highlighted with yellow arrows. The centerline profile of the capillary is "flattened" to show displacement and plotted over time (spatio-temporal plot, bottom). Change in displacement, dx, divided by change in time, dt reveals the velocity of cells. Blood velocities ~0.3-3 mm/second were measured by this method. Image field is 60 µm wide in top images.

through-focus video of the 3 retinal vascular layers, imaged with adaptive optics

Through-focus video of the trilaminar vascular layers of the living mammalian retina, imaged with adaptive optics

Blood cell velocity color coded

Non-invasive measurement of blood flow in a retinal arteriole.

lines that form a network

High resolution image of retinal capillaries

retinal pericytes

Retinal pericytes, imaged ex vivo with a microscope

Microscopic cells imaged in eye

Green pericytes surround capillaries of the living eye (imaged with AOSLO).

photo of the back of the eye

Pericytes (green) surround vessels of the eye (blue).

sparse mosaic of cells

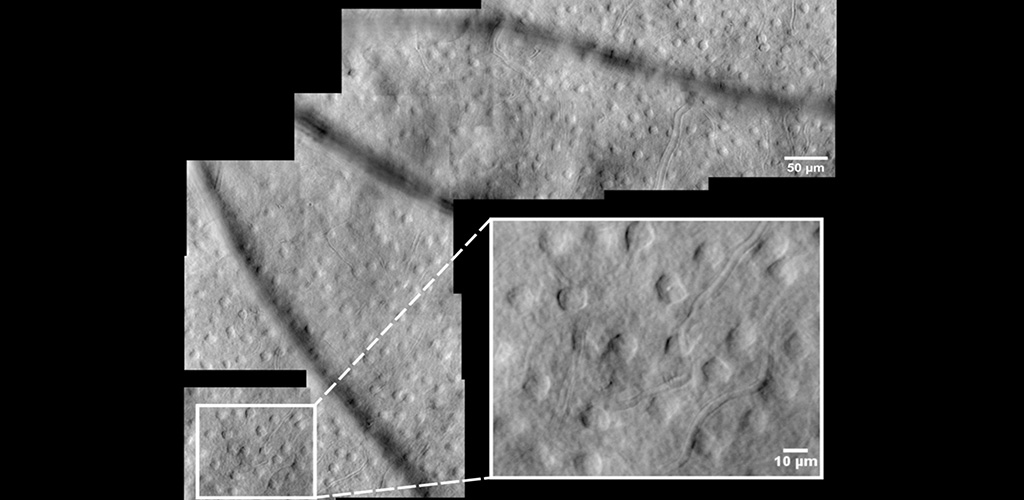
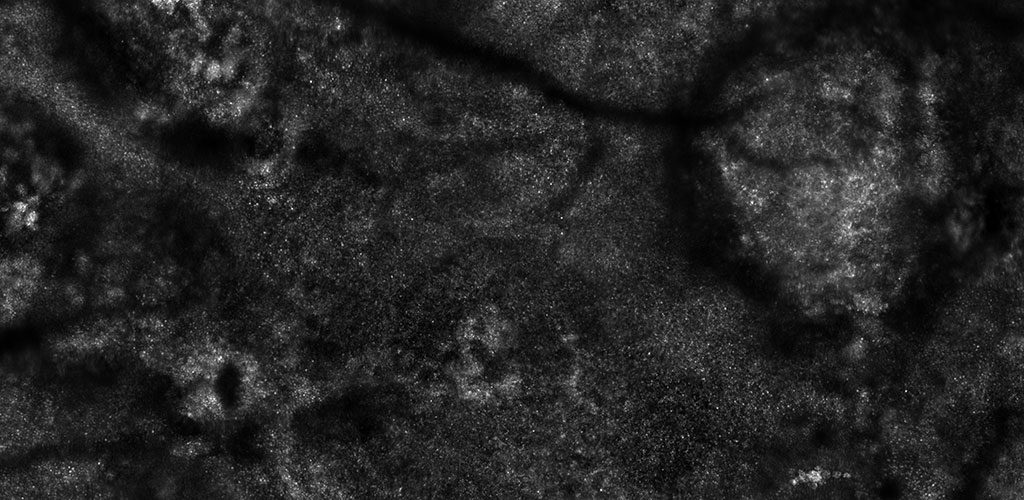
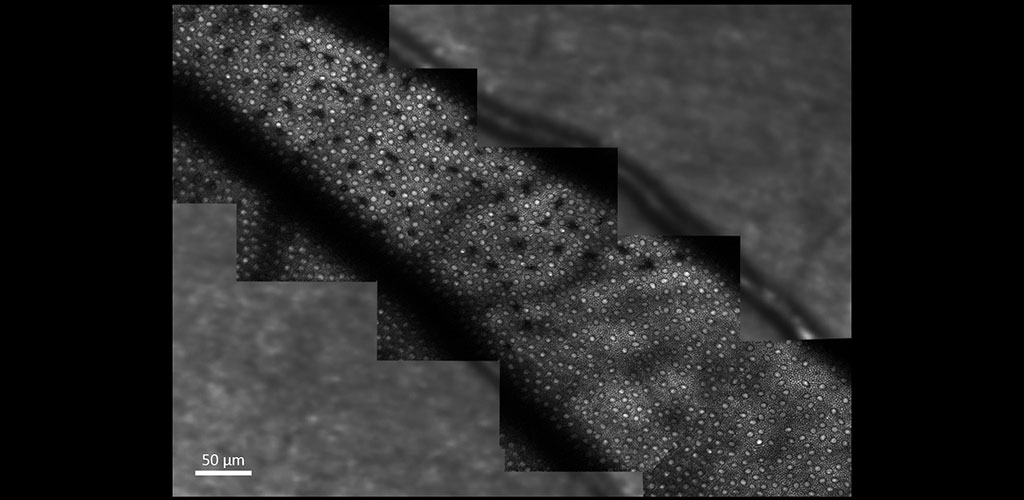
Sparse arrangement of horizontal cells imaged with label-free split-detection. Guevara et al. 2015. PDF

blood cells imaged in living eye

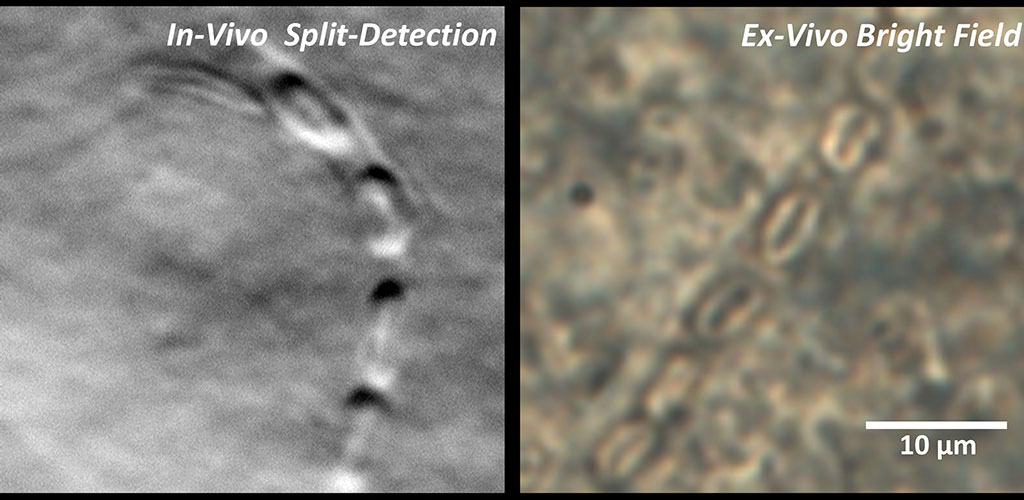
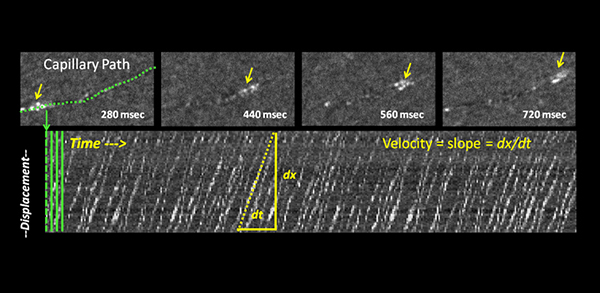
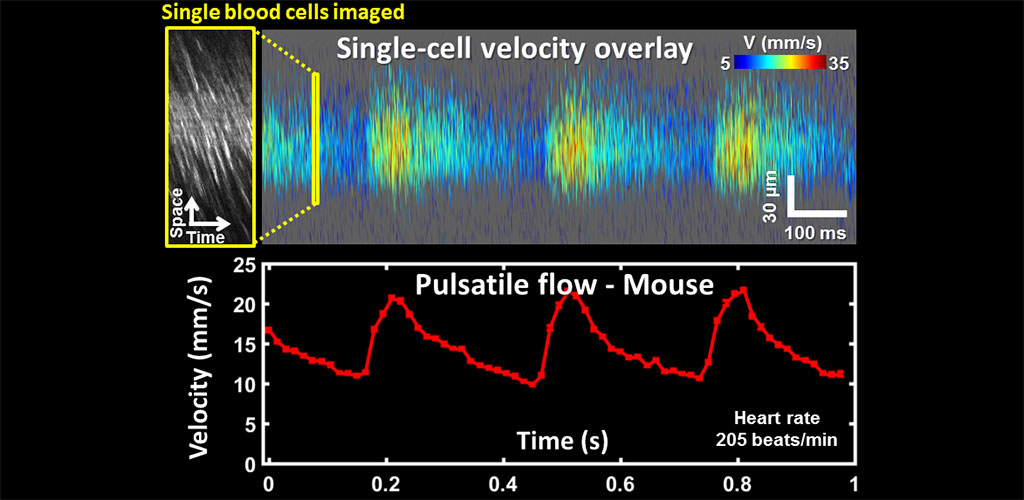
Phase-contrast image of red blood cells inside a retinal capillary in the living mammal. Guevara et al. 2016. PDF

Red blood cells

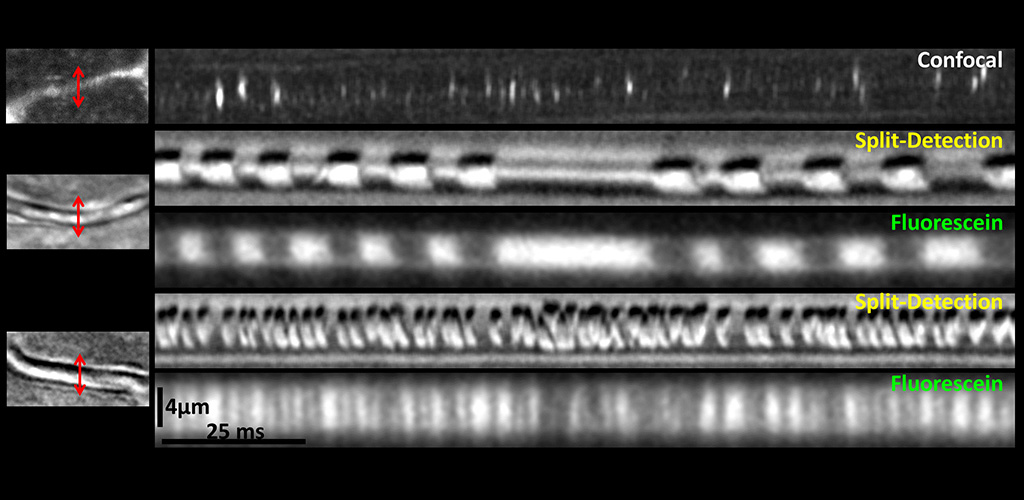
Red blood cells parachute through retinal capillaries seen with label-free split-detection imaging. Imaging with fluorescein shows labeled plasma with gaps when blood cells pass. Guevara et al. 2016. PDF

Red blood cells in living eye

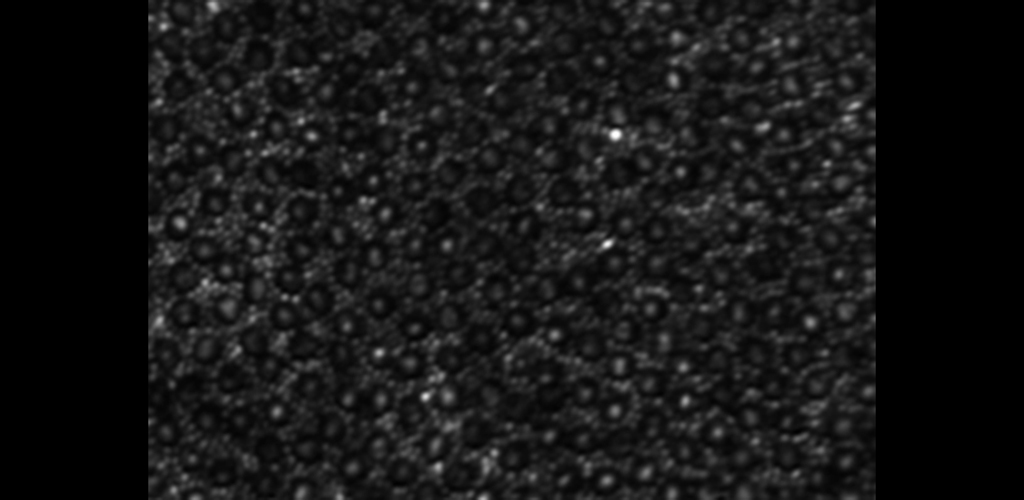
Red blood cell packing and flow in capillaries of the living eye. Guevara et al. 2016. PDF

microvascular cells

Pericytes labeled in a transgenic animal show microvascular network of the living retina.

Array of large and smaller cells

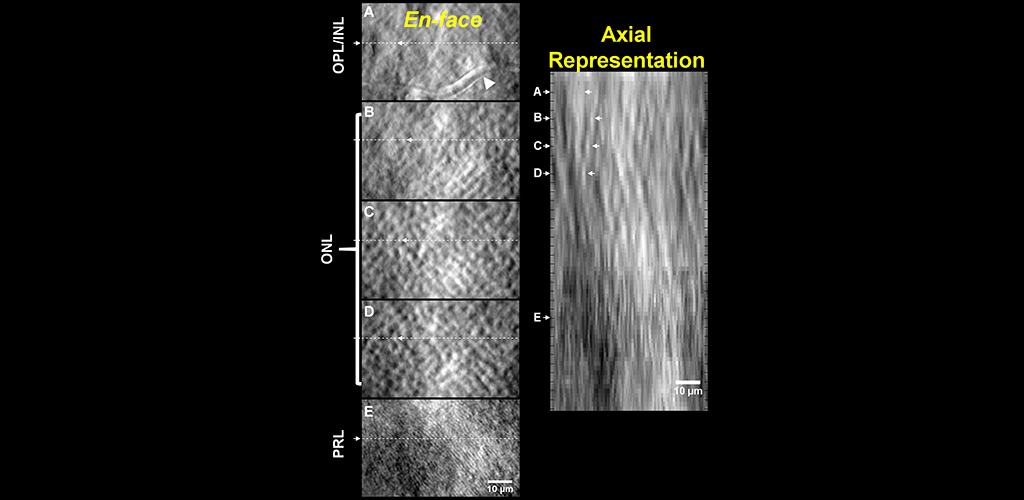
Split-detection in different layers of the retina shows the multilayered arrangement of photoreceptor somas and inner and outer segments below. Guevara et al. 2015. PDF

three capillary stratifications

With AOSLO, we can observe three distinct capillary stratifications in the mouse retinal circulation. The above image shows a through-focus capture of three distinct capillary stratifications. Image field is 5 degrees of visual angle, ~150 microns across.

photo of microvascular cells

3D rotational image of pericytes and vessels imaged with AOSLO.

color-coded orientation map of retinal blood vessels in a fundus picture. Each color shows a unique orientation/angle of a vessel

Vessels of the primate retina color coded by vessel angle.

photo of capillaries of the retina

The microvascular network imaged without contrast agents. The movement of single blood cells creates a spatio-temporal flicker. Motion contrast imaging reveals active perfusion in the vessels surrounding the fovea.

color photo of capillaries of the retina

A binary mask showing perfused vessels surrounding the fovea of the primate. Vessel angle is coded by color.

Green ring of cells

Fluorescent ring of ganglion cells serving the foveal cones. These cells are expressing the calcium indicator GCaMP, which allows cell responses to be monitored optically.

Left: Rainbow pattern over ganglion cell array. Right: Black and white bar stimulus

Phase map of ganglion cell responses to a 0.2Hz drifting grating visual stimulus presented to the foveal cones.

rods and cones

Human Retinal Diseases: Image of rods and cones

geographic atrophy

Human Retinal Diseases: AMD Geographic Atrophy

Bright cell bodies and dimmer lines connecting

Time-lapse imaging of retinal microglia in vivo. Schallek et al. ARVO e-abstract 2017

Cell with its extensions

Time-lapse imaging of retinal microglia in vivo. Schallek et al. ARVO e-abstract 2017

In vivo space-time image of a capillary showing 4 major constituents of blood including white blood cells, red blood cells, platelets, and plasma.

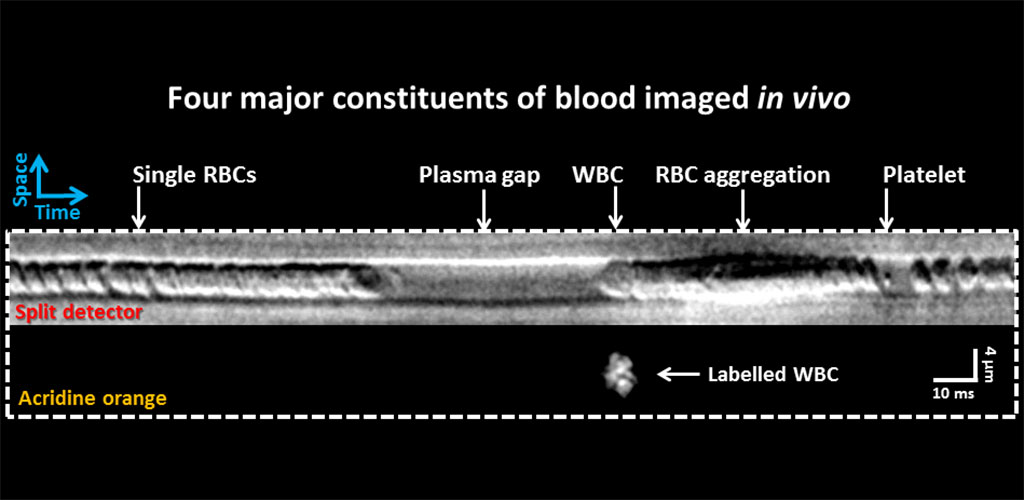
Immune Cell Imaging: In vivo flow cytometry. Joseph et al. ARVO e-abstract 2016

primate photoreceptors

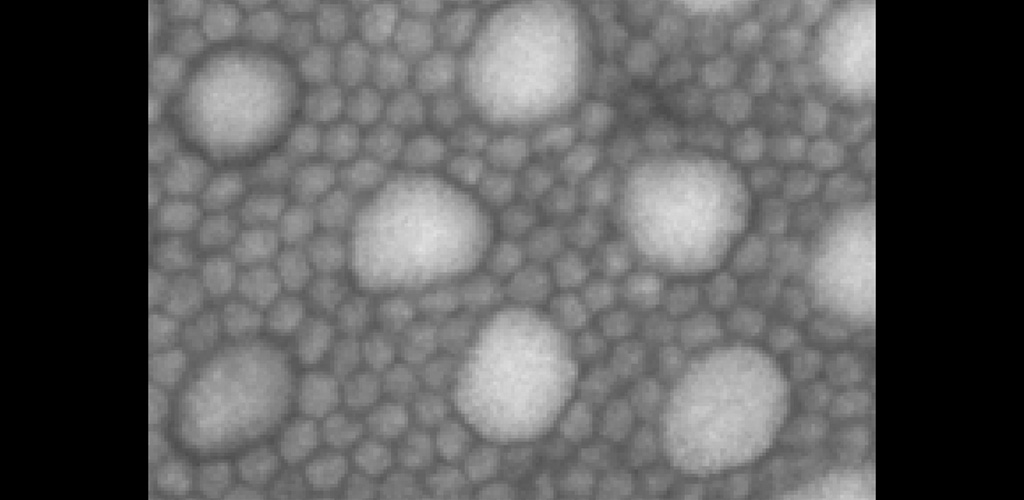
Two-photon Imaging of the Retina: Two-photon ex vivo image of photoreceptors in macaque macular region

macaque photoreceptors

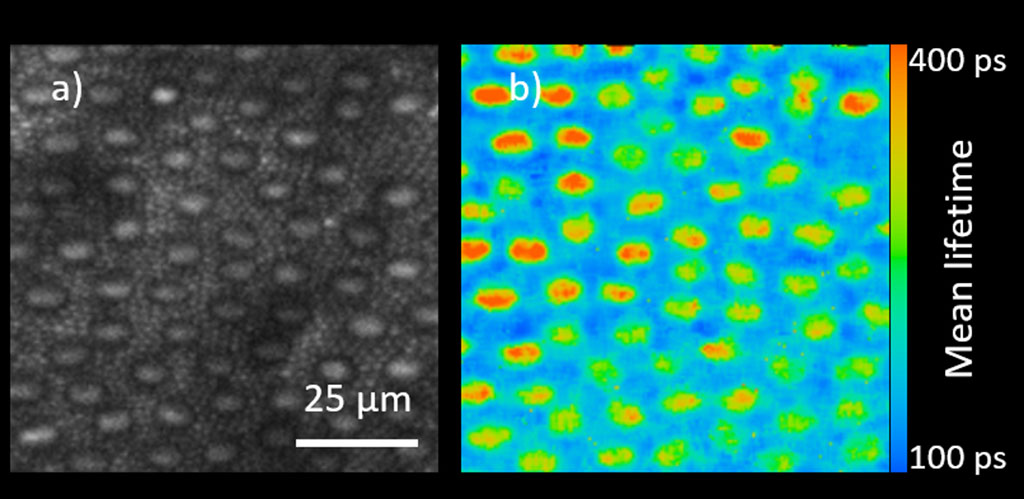
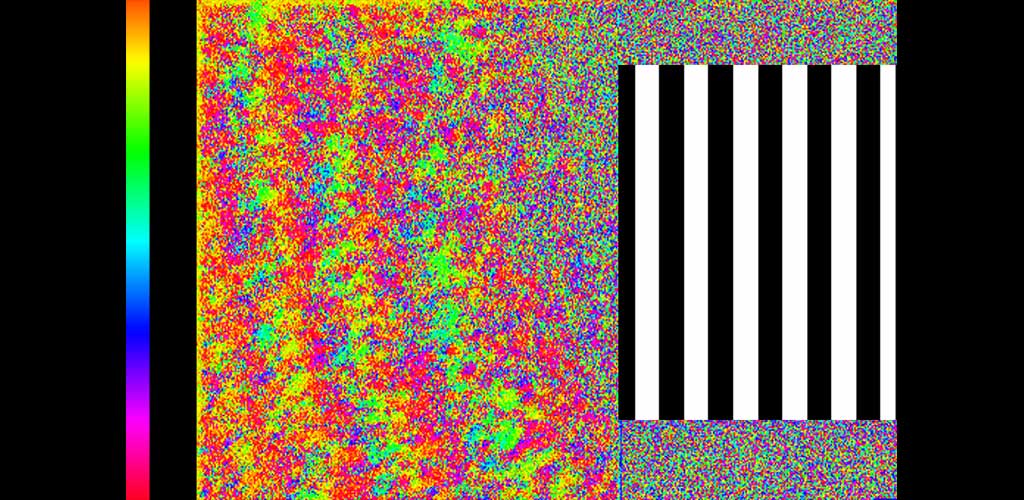
Two-photon Imaging of the Retina: In vivo macaque photoreceptor TPEF intensity (a) and corresponding AOFLIO (b) images displaying mean lifetime.

GFP-labeled ganglion cells

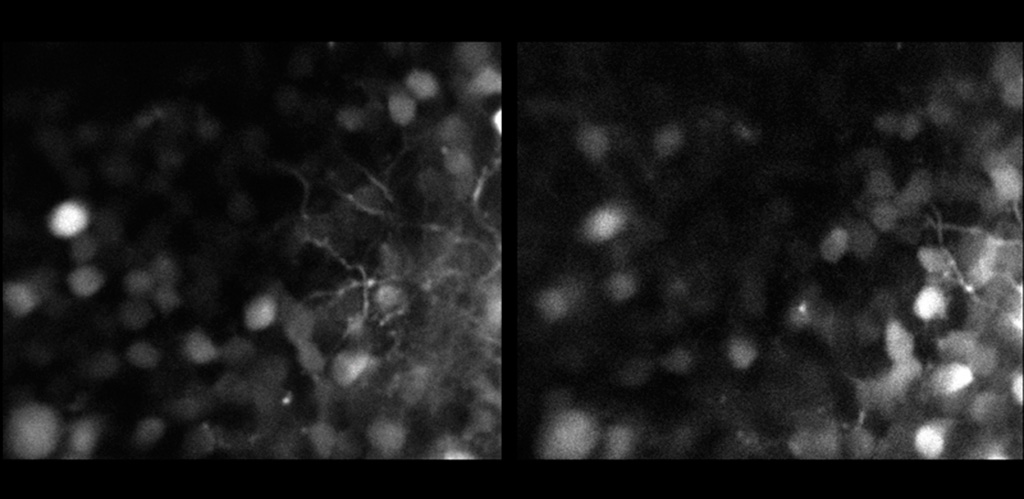
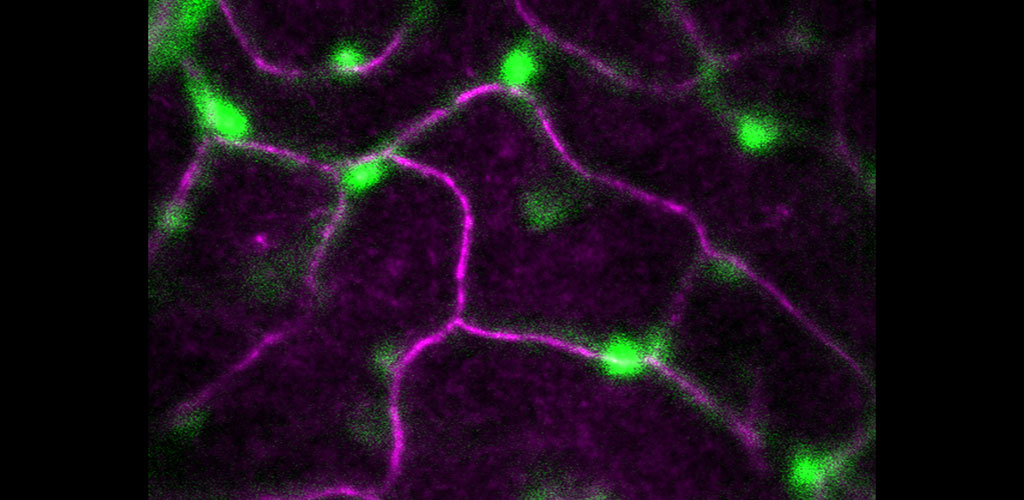
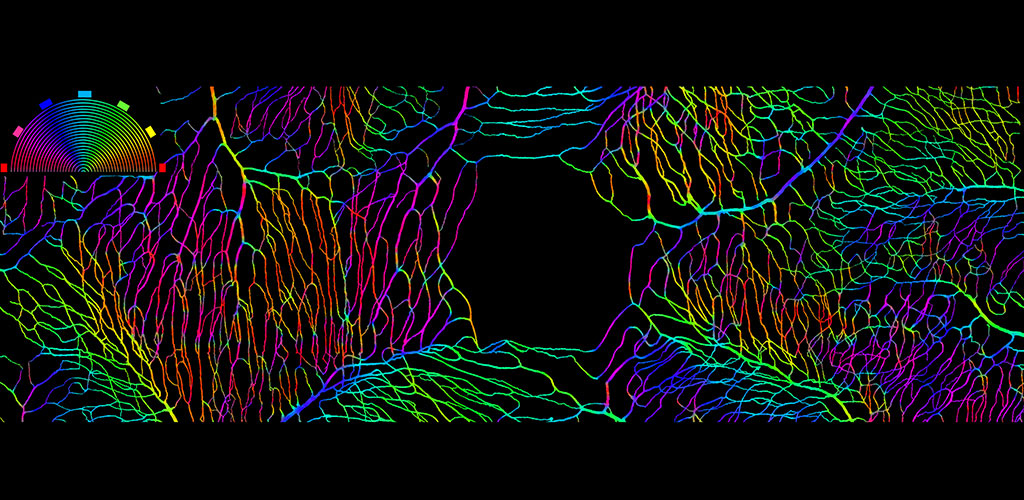
Two-photon Imaging of the Retina: Two-photon in vivo image of GFP-labeled ganglion cells in mouse. The two images are axially separated by 5µm

Ex vivo ganglion cells

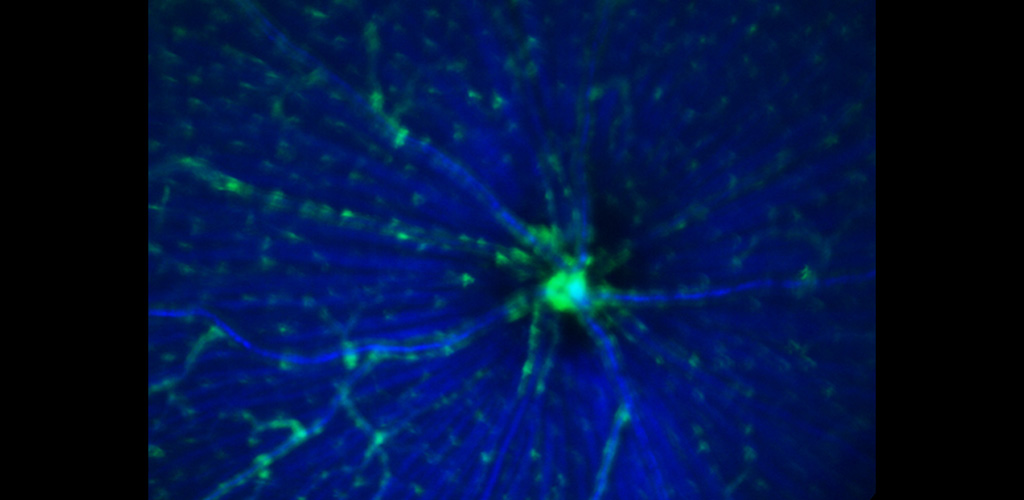
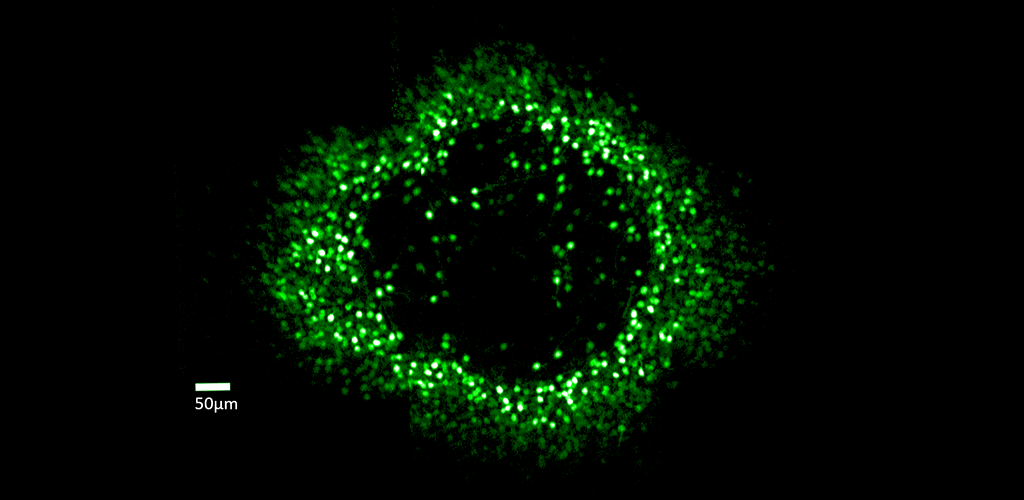
Two-photon Imaging of the Retina: Ex vivo two-photon microscopy image of ganglion cells below the nerve fiber layer

photoreceptor mosaic

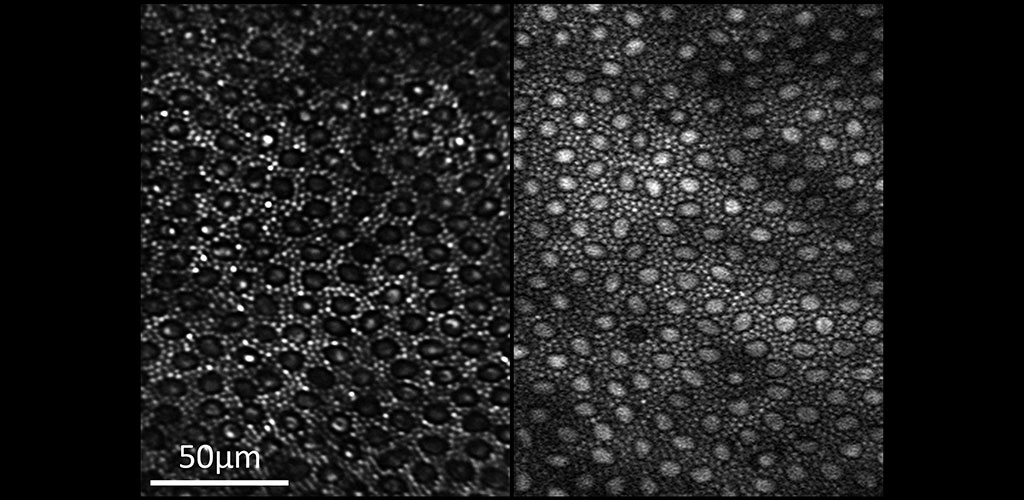
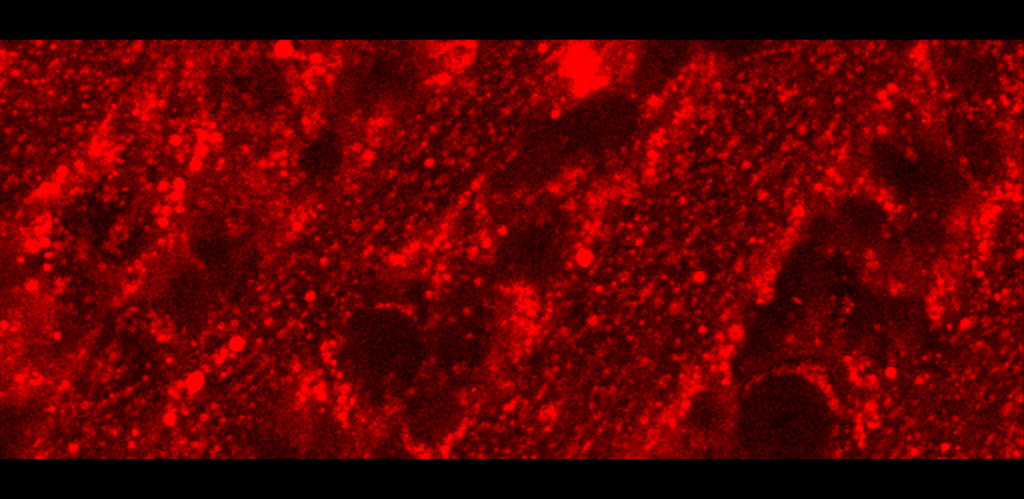
Two-photon Imaging of the Retina: Reflectance (left) and two-photon excited fluorescence (right) image of the photoreceptor mosaic in the living macaque eye. The main source of fluorescence is most likely all-trans-retinol.

loc88 montage

Two-photon Imaging of the Retina: The image shows two-photon excited fluorescence captured from photoreceptors in the living macaque eye where selective S cone damage was induced at different time points.

Play
Pause
blood flow imaged without contrast agents
through-focus video of the 3 retinal vascular layers, imaged with adaptive optics
Blood cell velocity color coded
lines that form a network
retinal pericytes
Microscopic cells imaged in eye
photo of the back of the eye
sparse mosaic of cells
blood cells imaged in living eye
Red blood cells
Red blood cells in living eye
microvascular cells
Array of large and smaller cells
three capillary stratifications
photo of microvascular cells
color-coded orientation map of retinal blood vessels in a fundus picture. Each color shows a unique orientation/angle of a vessel
photo of capillaries of the retina
color photo of capillaries of the retina
Green ring of cells
Left: Rainbow pattern over ganglion cell array. Right: Black and white bar stimulus
rods and cones
geographic atrophy
Bright cell bodies and dimmer lines connecting
Cell with its extensions
In vivo space-time image of a capillary showing 4 major constituents of blood including white blood cells, red blood cells, platelets, and plasma.
primate photoreceptors
macaque photoreceptors
GFP-labeled ganglion cells
Ex vivo ganglion cells
photoreceptor mosaic
loc88 montage