Immune Cell Imaging
The retina, being a 'window' to the brain and the rest of the body, offers the opportunity to non-invasively study single cells of the immune system in their native micro-environment, and also inspect the global health of the body. Our lab's work on immune cell imaging examines the highly dynamic immune function from milliseconds-to-months in conditions of health and disease.
Imaging microglia dynamics in health and disease
Microglia are resident immune cells found in the retina and the brain. These cells provide constant surveillance of their surrounding neural tissue and ingest cellular debris. Microglia respond to injury by physically migrating as a whole towards the site of injury. In the healthy brain, each microglial cell also surveys its immediate surrounding by continuously extending and retracting its processes while keeping its somas stationary.
In the image below, we used adaptive optics to image the fine process dynamics of microglial cells in the retina.
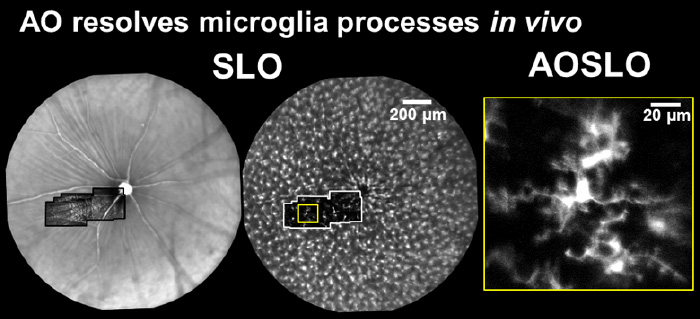
Microglial processes are highly motile while cell somas were relatively very stable over the course of hours. Process motility was quantified using strategies similar to that used for quantifying blood cell speed. Process velocity moves at a snail's pace at the range of 0-6.4 µm/s (Schallek et al. ARVO e-abstract 2017), similar to the range reported in the brain.
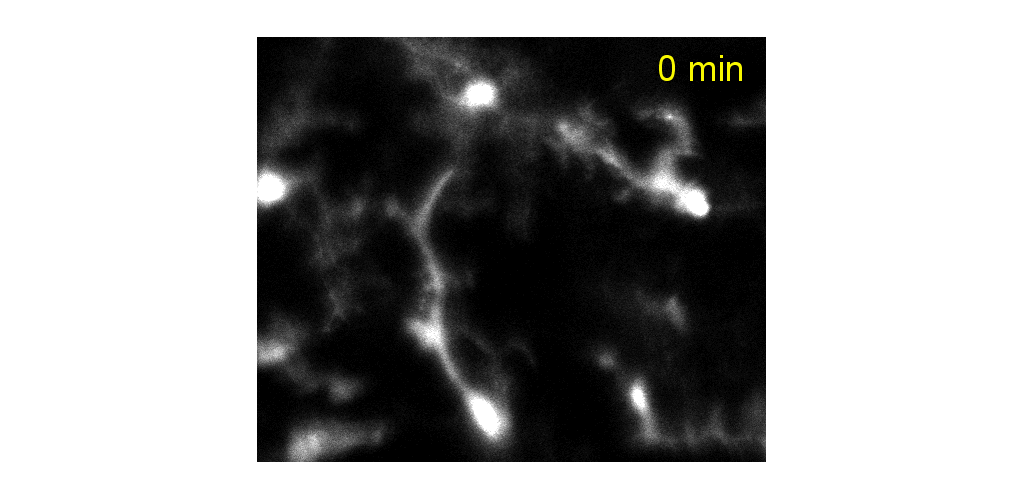
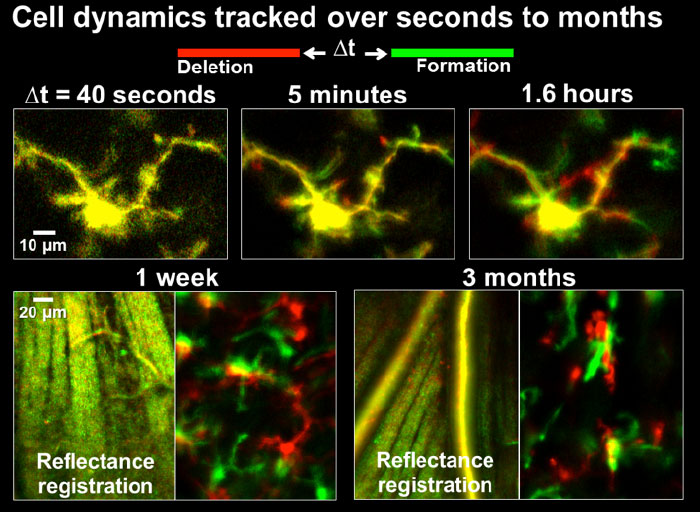
Microglial cells can be tracked from milliseconds-to months. Cell processes are highly motile during minutes to hours, cell somas can also be observed to migrate during weeks to months.
In vivo flow cytometry: Imaging single white blood cells and blood composition
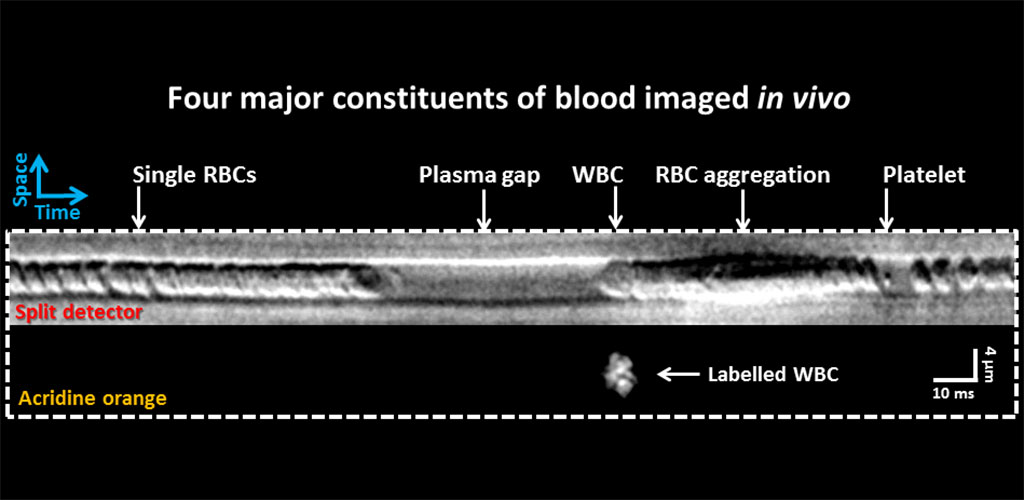
We use split detection to image single red and white blood cells in vivo as they pass in single file through a capillary (Guevara-Torres et al. 2016). In the image below, we augmented this strategy to simultaneously image fluorescence from labelled white blood cells in a mouse. One white blood cell (leukocyte) was imaged for every 3-10 thousand RBCs. Sluggish WBCs often have a gap of plasma preceding their passage and are often followed by an impaction of red blood cells.
We are also developing a measure of CBC or complete blood count based on these non-invasive measurements. This line of work may eventually obviate the need for a blood draw by turning the eye into an in vivo flow cytometer (Joseph et al. ARVO e-abstract 2016).
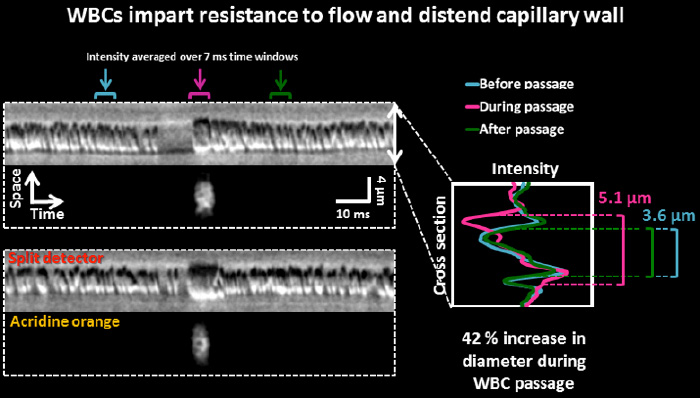
White blood cells are often larger than red blood cells. We observe that white blood cells often distend the capillary wall when passing through single capillaries. This behavior may contribute to capillary non-perfusion in conditions of inflammatory disease such as diabetic retinopathy.
Funding Sources
- Dana Foundation- David Mahoney Neuroimaging Grant: Title: Imaging single blood cell rheology and flux within the smallest vessels in clinical diabetic retinopathy. Jesse Schallek, PI
- Research to Prevent Blindness Career Development Award: Title: Imaging microscopic changes in retinal capillary structure and function associated with hyperglycemia in a mouse model of diabetes. Jesse Schallek, PI
Publications
- Joseph A, Chu CJ, Feng G, Dholakia K, Schallek J (2020). Label-free imaging of immune cell dynamics in the living retina using adaptive optics. eLife. S2213-6711(20)30240-X. doi: 10.7554/eLife.60547
- Guevara-Torres A, Williams DR, Schallek J (2020). Origin of cell contrast in offset aperture adaptive optics ophthalmoscopy. Optics Letters 45(4), 840-843. PDF
- Guevara-Torres A, Joseph A, & Schallek JB (2016). Label free measurement of retinal blood cell flux, velocity, hematocrit and capillary width in the living mouse eye. Biomed. Opt. Express, BOE 7, 4228–4249. PDF